Dashboards
Easy to access charts to review your productivity
Dashboards
Review and analyze your productivity and upcoming workload
CURRENT STATUS
What’s due and overdue by importance, urgency, impact and effort.
UPCOMING
Your tasks by day for the next 2 weeks by priority.
PRODUCTIVITY
Tracks your productivity by day, by week and by month.
OPPORTUNITIES
Gain insight into “troublesome” tasks and opportunities to get more things done.
Overdue by Priority
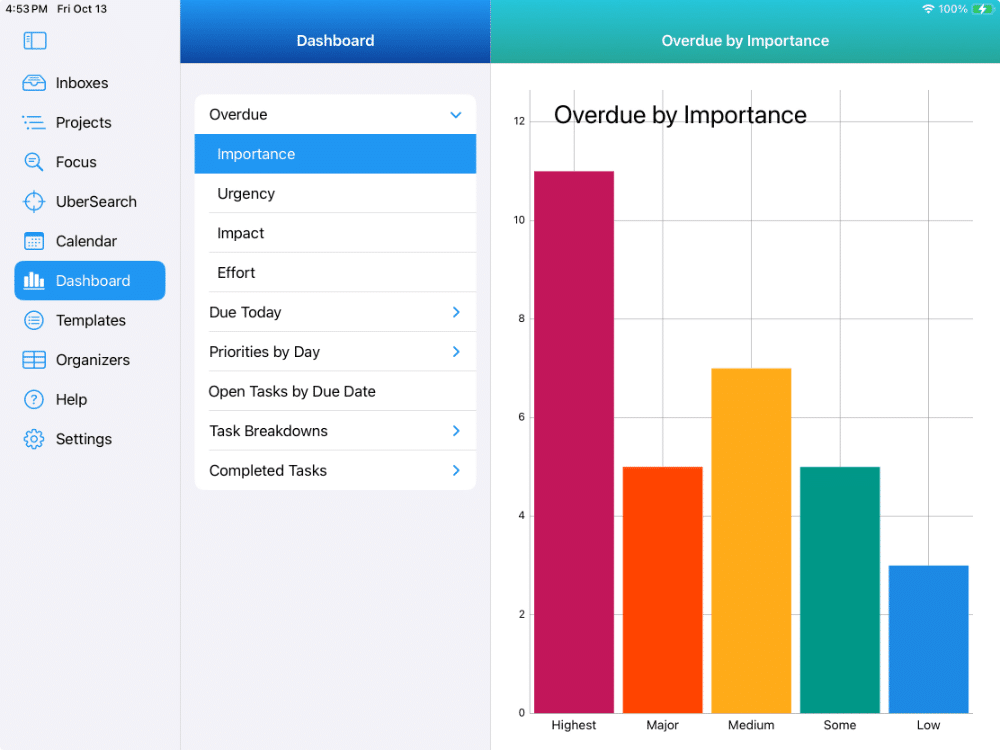
Review Dashboards to see what’s overdue by priority levels
IMPORTANCE
A bar chart showing the number of tasks overdue for each level of importance.
URGENCY
A bar chart showing the number of tasks overdue for each level of urgency.
IMPACT
A bar chart showing the number of tasks overdue for each level of impact.
EFFORT
A bar chart showing the number of tasks overdue for each level of effort.
Due Today By Priority
Review Dashboards to see what’s due today by priority levels
IMPORTANCE
A bar chart showing the number of tasks due today for each level of importance.
URGENCY
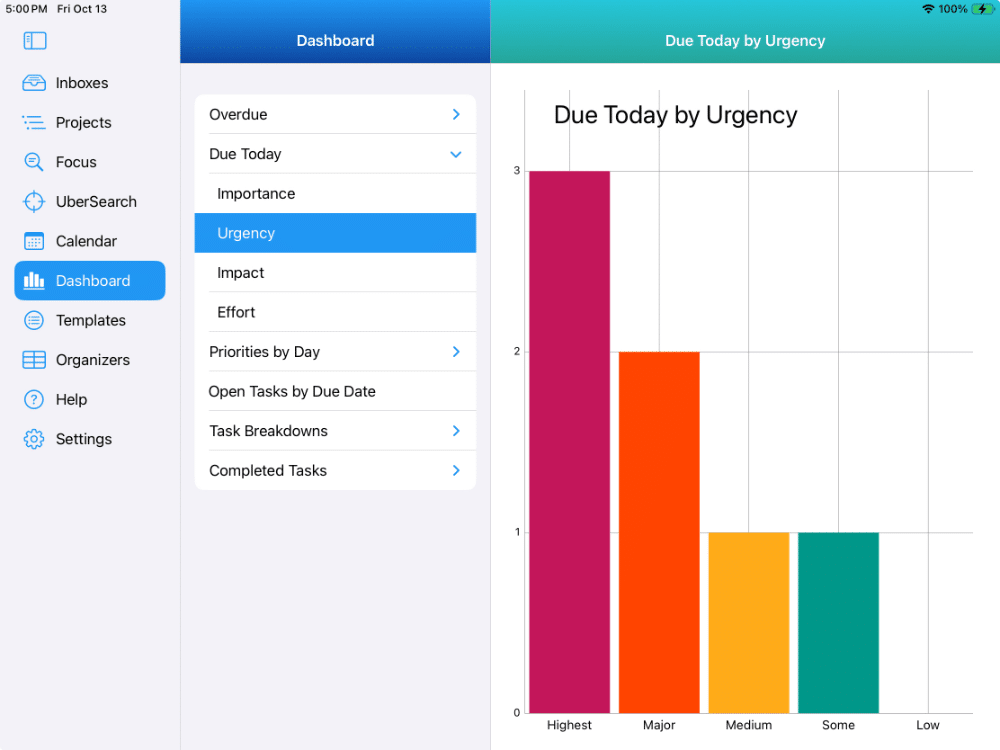
A bar chart showing the number of tasks due today for each level of urgency.
IMPACT
A bar chart showing the number of tasks due today for each level of impact.
EFFORT
A bar chart showing the number of tasks due today for each level of effort.
Priorities By Day
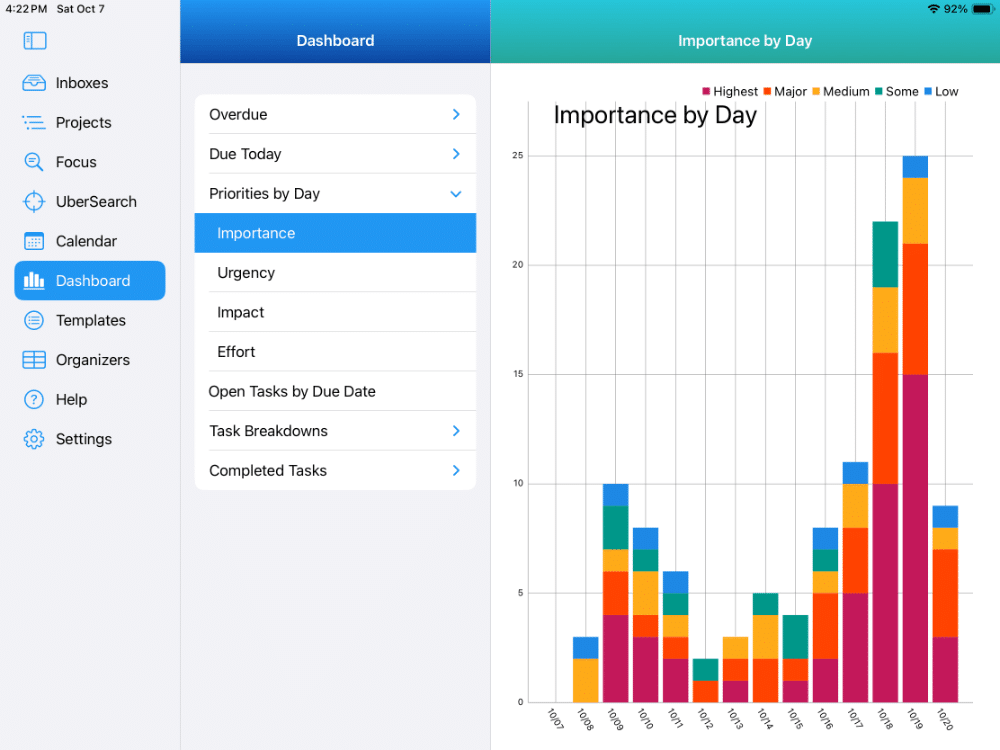
Review Dashboards to see a stacked bar chart of tasks
for the next 14 days by priority levels
BY IMPORTANCE
A bar chart showing the number of tasks by importance level for the next 14 days.
BY URGENCY
A bar chart showing the number of tasks by urgency level for the next 14 days.
BY IMPACT
A bar chart showing the number of tasks by impact level for the next 14 days.
BY EFFORT
A bar chart showing the number of tasks by effort level for the next 14 days.
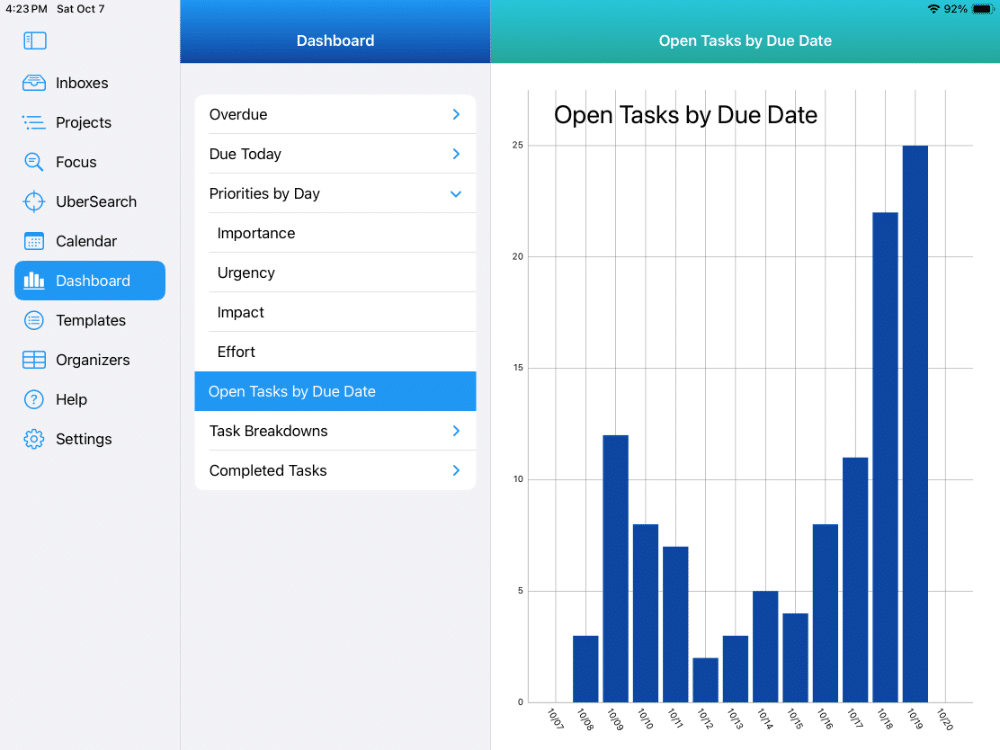
Open Tasks By Due Date
Get a high level look at your upcoming task load
Task Breakdowns
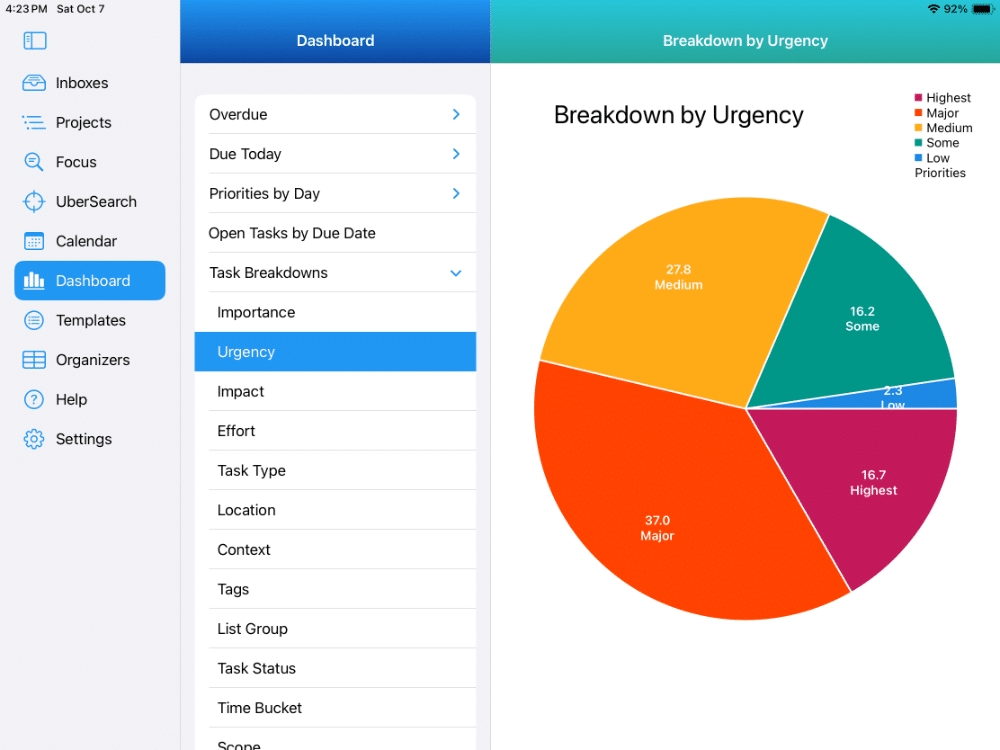
In Dashboards, see Task Breakdowns for each priority and task organizer
BY PRIORITIES
4 Individual pie charts showing the percentage of each level for importance, urgency, impact and effort.
BY TASK ORGANIZER
9 Individual bar charts showing the number of tasks for a Task type, Location, Context, Tag, List Group, Task Status, Persona, Time Bucket, and Scope.
Completed Tasks
Check out your productivity and productivity trends
BY DAY
A quick graphical snapshot of tasks you’ve completed for the last 14 days.
BY WEEK
A quick graphical snapshot of tasks you’ve completed for the last 12 weeks.
BY MONTH
A quick graphical snapshot of tasks you’ve completed for the last 12 months.
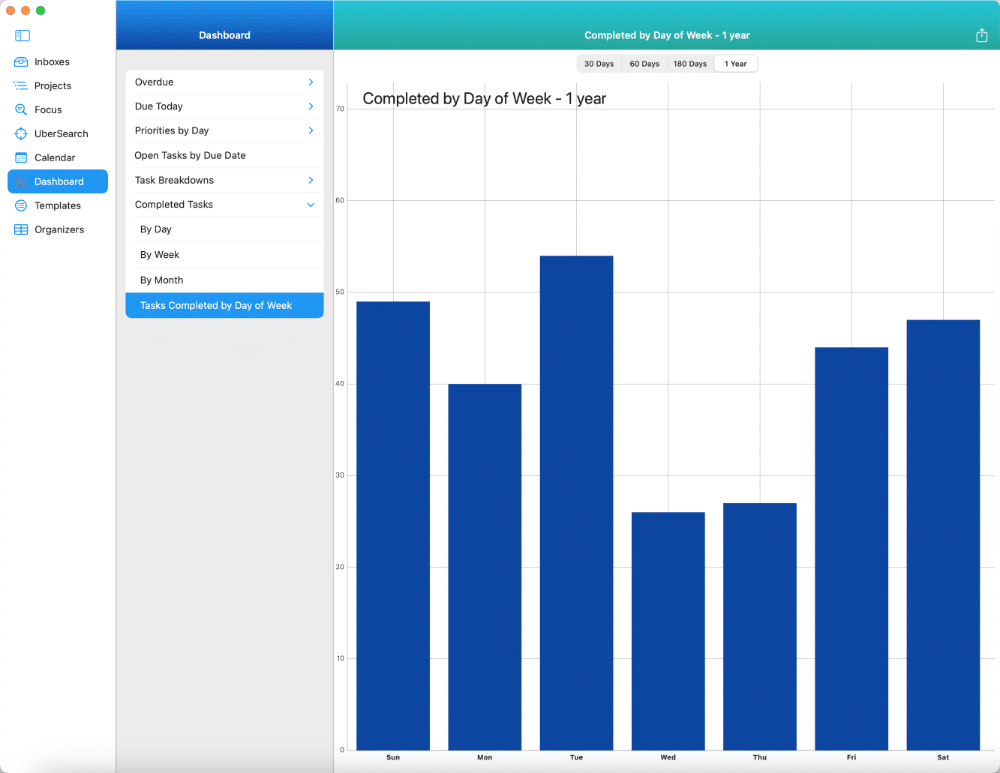
BY DAY OF WEEK
A quick graphical snapshot of tasks you’ve completed by day of the week.
Available on The App Store Now!
IdeasToDone Premium - $2.99 per Month or $29.99 per Year
1-Month Free Trial, Risk-Free
Download It Today!
ABOUT
DEVICE SUPPORT
FEATURES
VERSIONS
COMMUNICATION
© Productive Life Inc. 2023. All rights reserved.

